
Experiment tracking#
Important: SQliteTracker got a big upgrade in version 0.8.2 so ensure you are running such version or a higher one.
SQLiteTracker provides a powerful and flexible way to track computational (e.g., Machine Learning) experiments using a SQLite database. Allows you to use SQL as the query language, giving you a powerful tool for experiment comparison, and comes with plotting features to compare plots side-by-side and to combine plots for better comparison.
Read more about the motivations in our blog post, check out the HN discussion.
This tutorial will walk you through the features with a Machine Learning use case; however, the tracker is generic enough to be used in any other domains.
from pathlib import Path

from sklearn import datasets
from sklearn.ensemble import RandomForestClassifier
from sklearn.linear_model import LogisticRegression
from sklearn.tree import DecisionTreeClassifier
from sklearn.svm import SVC
from sklearn.model_selection import train_test_split
from sklearn.metrics import accuracy_score, RocCurveDisplay
# delete our example database, if any
db = Path("my_experiments.db")

if db.exists():
    db.unlink()
from sklearn_evaluation import SQLiteTracker

tracker = SQLiteTracker("my_experiments.db")
X, y = datasets.make_classification(200, 10, n_informative=5, class_sep=0.65)
X_train, X_test, y_train, y_test = train_test_split(
    X, y, test_size=0.33, random_state=42
)

models = [RandomForestClassifier(), LogisticRegression(), DecisionTreeClassifier()]
Training and logging models#
for m in models:
    model = type(m).__name__
    print(f"Fitting {model}")

    experiment = tracker.new_experiment()
    m.fit(X_train, y_train)
    y_pred = m.predict(X_test)
    acc = accuracy_score(y_test, y_pred)

    # log a dictionary with log_dict
    experiment.log_dict({"accuracy": acc, "model": model, **m.get_params()})
Show code cell output
Fitting RandomForestClassifier
Fitting LogisticRegression
Fitting DecisionTreeClassifier
Or use .log(key, value) to log individual values:
svc = SVC()
svc.fit(X_train, y_train)
y_pred = svc.predict(X_test)
acc = accuracy_score(y_test, y_pred)

experiment = tracker.new_experiment()

# log individual values
experiment.log("accuracy", acc)
experiment.log("model", type(svc).__name__)

_ = experiment.log_dict(svc.get_params())
Displaying latest experiments#
Display the tracker object to show last experiments:
tracker
SQLiteTracker
| uuid | created | parameters | comment |
|---|---|---|---|
| 747fa9d4 | 2023-04-11 16:51:24 | {"accuracy": 0.696969696969697, "model": "DecisionTreeClassifier", "ccp_alpha": 0.0, "class_weight": null, "criterion": "gini", "max_depth": null, "max_features": null, "max_leaf_nodes": null, "min_impurity_decrease": 0.0, "min_samples_leaf": 1, "min_samples_split": 2, "min_weight_fraction_leaf": 0.0, "random_state": null, "splitter": "best"} | |
| 68edf4bf | 2023-04-11 16:51:24 | {"accuracy": 0.7878787878787878, "model": "SVC", "C": 1.0, "break_ties": false, "cache_size": 200, "class_weight": null, "coef0": 0.0, "decision_function_shape": "ovr", "degree": 3, "gamma": "scale", "kernel": "rbf", "max_iter": -1, "probability": false, "random_state": null, "shrinking": true, "tol": 0.001, "verbose": false} | |
| c5d9d833 | 2023-04-11 16:51:23 | {"accuracy": 0.7727272727272727, "model": "RandomForestClassifier", "bootstrap": true, "ccp_alpha": 0.0, "class_weight": null, "criterion": "gini", "max_depth": null, "max_features": "sqrt", "max_leaf_nodes": null, "max_samples": null, "min_impurity_decrease": 0.0, "min_samples_leaf": 1, "min_samples_split": 2, "min_weight_fraction_leaf": 0.0, "n_estimators": 100, "n_jobs": null, "oob_score": false, "random_state": null, "verbose": 0, "warm_start": false} | |
| e2d541ae | 2023-04-11 16:51:23 | {"accuracy": 0.6818181818181818, "model": "LogisticRegression", "C": 1.0, "class_weight": null, "dual": false, "fit_intercept": true, "intercept_scaling": 1, "l1_ratio": null, "max_iter": 100, "multi_class": "auto", "n_jobs": null, "penalty": "l2", "random_state": null, "solver": "lbfgs", "tol": 0.0001, "verbose": 0, "warm_start": false} |
(Most recent experiments)
Querying experiments with SQL using .query()#
You can use SQL to query your experiments. To see what’s been logged, use get_parameters_keys():
keys = tracker.get_parameters_keys()
# show first 5 keys
keys[:5]
['C', 'accuracy', 'bootstrap', 'break_ties', 'cache_size']
To generate a sample query, use .get_sample_query():
print(tracker.get_sample_query())
SELECT
    uuid,
    json_extract(parameters, '$.C') as C,
    json_extract(parameters, '$.accuracy') as accuracy,
    json_extract(parameters, '$.bootstrap') as bootstrap,
    json_extract(parameters, '$.break_ties') as break_ties,
    json_extract(parameters, '$.cache_size') as cache_size,
    json_extract(parameters, '$.ccp_alpha') as ccp_alpha,
    json_extract(parameters, '$.class_weight') as class_weight,
    json_extract(parameters, '$.coef0') as coef0,
    json_extract(parameters, '$.criterion') as criterion,
    json_extract(parameters, '$.decision_function_shape') as decision_function_shape,
    json_extract(parameters, '$.degree') as degree,
    json_extract(parameters, '$.dual') as dual,
    json_extract(parameters, '$.fit_intercept') as fit_intercept,
    json_extract(parameters, '$.gamma') as gamma,
    json_extract(parameters, '$.intercept_scaling') as intercept_scaling,
    json_extract(parameters, '$.kernel') as kernel,
    json_extract(parameters, '$.l1_ratio') as l1_ratio,
    json_extract(parameters, '$.max_depth') as max_depth,
    json_extract(parameters, '$.max_features') as max_features,
    json_extract(parameters, '$.max_iter') as max_iter,
    json_extract(parameters, '$.max_leaf_nodes') as max_leaf_nodes,
    json_extract(parameters, '$.max_samples') as max_samples,
    json_extract(parameters, '$.min_impurity_decrease') as min_impurity_decrease,
    json_extract(parameters, '$.min_samples_leaf') as min_samples_leaf,
    json_extract(parameters, '$.min_samples_split') as min_samples_split,
    json_extract(parameters, '$.min_weight_fraction_leaf') as min_weight_fraction_leaf,
    json_extract(parameters, '$.model') as model,
    json_extract(parameters, '$.multi_class') as multi_class,
    json_extract(parameters, '$.n_estimators') as n_estimators,
    json_extract(parameters, '$.n_jobs') as n_jobs,
    json_extract(parameters, '$.oob_score') as oob_score,
    json_extract(parameters, '$.penalty') as penalty,
    json_extract(parameters, '$.probability') as probability,
    json_extract(parameters, '$.random_state') as random_state,
    json_extract(parameters, '$.shrinking') as shrinking,
    json_extract(parameters, '$.solver') as solver,
    json_extract(parameters, '$.splitter') as splitter,
    json_extract(parameters, '$.tol') as tol,
    json_extract(parameters, '$.verbose') as verbose,
    json_extract(parameters, '$.warm_start') as warm_start
    FROM experiments
LIMIT 10
To execute a query, use .query():
ordered = tracker.query(
    """
SELECT uuid,
       json_extract(parameters, '$.model') AS model,
       json_extract(parameters, '$.accuracy') AS accuracy
FROM experiments
ORDER BY accuracy DESC
"""
)
ordered
| model | accuracy | |
|---|---|---|
| uuid | ||
| 68edf4bf | SVC | 0.787879 |
| c5d9d833 | RandomForestClassifier | 0.772727 |
| 747fa9d4 | DecisionTreeClassifier | 0.696970 |
| e2d541ae | LogisticRegression | 0.681818 |
The query method returns a data frame with “uuid” as the index:
type(ordered)
pandas.core.frame.DataFrame
Storing plots#
You can log a confusion matrix and classification reports:
%%capture


def fit(model):
    model.fit(X_train, y_train)
    y_pred = model.predict(X_test)
    acc = accuracy_score(y_test, y_pred)
    experiment = tracker.new_experiment()
    experiment.log_dict(
        {"accuracy": acc, "model": type(model).__name__, **model.get_params()}
    )

    # log plots
    experiment.log_confusion_matrix(y_test, y_pred)
    experiment.log_classification_report(y_test, y_pred)

    # log generic matplotlib figure
    roc = RocCurveDisplay.from_estimator(model, X_test, y_test)
    experiment.log_figure("roc", roc.figure_)


fit(model=RandomForestClassifier(n_estimators=100))
fit(model=RandomForestClassifier(n_estimators=10))
tracker.recent(2)
| created | parameters | comment | |
|---|---|---|---|
| uuid | |||
| 747fa9d4 | 2023-04-11 16:51:24 | {"accuracy": 0.696969696969697, "model": "Deci... | None |
| 68edf4bf | 2023-04-11 16:51:24 | {"accuracy": 0.7878787878787878, "model": "SVC... | None |
Rendering plots in table view#
The .query() method also allows rendering plots in the table view:
results = tracker.query(
    """
SELECT uuid,
       json_extract(parameters, '$.model') AS model,
       json_extract(parameters, '$.accuracy') AS accuracy,
       json_extract(parameters, '$.confusion_matrix') AS cm,
       json_extract(parameters, '$.roc') AS roc
FROM experiments
WHERE accuracy IS NOT NULL
AND cm IS NOT NULL
AND roc IS NOT NULL
ORDER BY created DESC
LIMIT 2
""",
    as_frame=False,
    render_plots=True,
)

results
| uuid | model | accuracy | cm | roc |
|---|---|---|---|---|
| 4b2656e5 | RandomForestClassifier | 0.772727 |  |  |
| be5f2c0c | RandomForestClassifier | 0.757576 |  |  |
Side-by-side comparison#
From the .query() results, you can extract a given column for a side by side comparison:
results.get("cm")
You can change the labels in the tabs with the index_by argument:
results.get("cm", index_by="accuracy")
Combining plots#
With a side-by-side comparison, it might be hard to spot the model performance differents, you can get individual experiments, extract their plots and combine them:
# get the uuids for the latest 2 experiments
uuid1, uuid2 = results.get("uuid")

# get the experiments
one = tracker.get(uuid1)
another = tracker.get(uuid2)
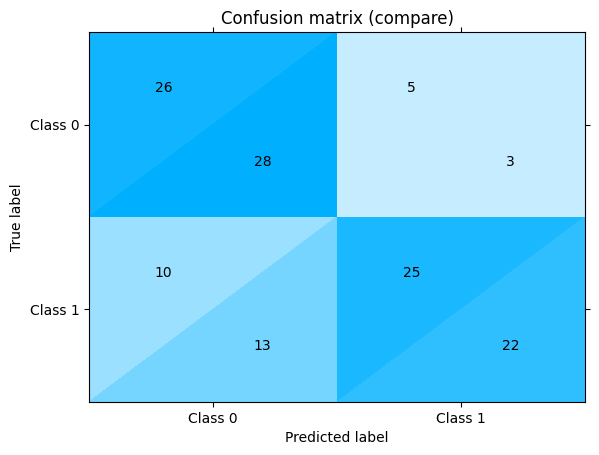
Combine statistics from both confusion matrices:
one["confusion_matrix"] + another["confusion_matrix"]
<sklearn_evaluation.plot.classification.ConfusionMatrixAdd at 0x7f4b631a4d60>
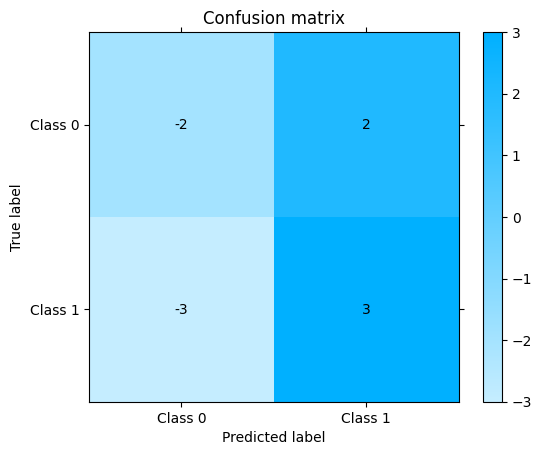
Get confusion matrix differences:
one["confusion_matrix"] - another["confusion_matrix"]
<sklearn_evaluation.plot.classification.ConfusionMatrixSub at 0x7f4b619f9e10>
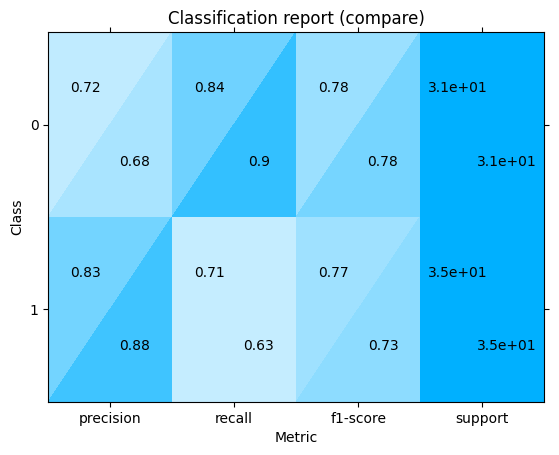
Combine classification reports:
one["classification_report"] + another["classification_report"]
<sklearn_evaluation.plot.classification_report.ClassificationReportAdd at 0x7f4b62dc2c80>
You can also retrieve generic figures (logged with log_figure):
one["roc"]
However, note that plot combination (plot1 + plot2 and plot1 - plot2) is only supported by plots logged via the experiment.log_* and not by the generic experiment.log_figure method.
Adding comments#
one.comment("This is some comment")
tracker.query(
    """
SELECT uuid,
       comment,
       json_extract(parameters, '$.model') AS model,
       json_extract(parameters, '$.accuracy') AS accuracy
FROM experiments
WHERE comment is not NULL
"""
)
| comment | model | accuracy | |
|---|---|---|---|
| uuid | |||
| 4b2656e5 | This is some comment | RandomForestClassifier | 0.772727 |
Append experiment parameters#
Log initial metric_a values for the experiment
one.log("metric_a", [0.2, 0.3])
tracker.get(one.uuid)["metric_a"]
[0.2, 0.3]
Appending new “metric_a” values and adding “metric_b” values
tracker.upsert_append(one.uuid, {"metric_a": 0.4, "metric_b": [0.8, 0.9]})
df = tracker.query(
    """
SELECT uuid,
       json_extract(parameters, '$.metric_a') AS metric_a,
       json_extract(parameters, '$.metric_b') AS metric_b
FROM experiments
"""
)
df
| metric_a | metric_b | |
|---|---|---|
| uuid | ||
| c5d9d833 | None | None |
| e2d541ae | None | None |
| 747fa9d4 | None | None |
| 68edf4bf | None | None |
| 4b2656e5 | [0.2,0.3,0.4] | [0.8,0.9] |
| be5f2c0c | None | None |
Pandas integration#
Getting recent experiments#
The recent method also returns a data frame:
df = tracker.recent()
df
| created | parameters | comment | |
|---|---|---|---|
| uuid | |||
| 747fa9d4 | 2023-04-11 16:51:24 | {"accuracy": 0.696969696969697, "model": "Deci... | None |
| 68edf4bf | 2023-04-11 16:51:24 | {"accuracy": 0.7878787878787878, "model": "SVC... | None |
| 4b2656e5 | 2023-04-11 16:51:24 | {"accuracy": 0.7727272727272727, "model": "Ran... | This is some comment |
| be5f2c0c | 2023-04-11 16:51:24 | {"accuracy": 0.7575757575757576, "model": "Ran... | None |
| c5d9d833 | 2023-04-11 16:51:23 | {"accuracy": 0.7727272727272727, "model": "Ran... | None |
Pass normalize=True to convert the nested JSON dictionary into columns:
df = tracker.recent(normalize=True)
df
| created | accuracy | model | ccp_alpha | class_weight | criterion | max_depth | max_features | max_leaf_nodes | min_impurity_decrease | ... | confusion_matrix.cm | confusion_matrix.normalize | confusion_matrix.target_names | confusion_matrix.version | classification_report.class | classification_report.matrix | classification_report.keys | classification_report.target_names | classification_report.version | comment | |
|---|---|---|---|---|---|---|---|---|---|---|---|---|---|---|---|---|---|---|---|---|---|
| uuid | |||||||||||||||||||||
| 747fa9d4 | 2023-04-11 16:51:24 | 0.696970 | DecisionTreeClassifier | 0.0 | None | gini | NaN | None | NaN | 0.0 | ... | NaN | NaN | NaN | NaN | NaN | NaN | NaN | NaN | NaN | None |
| 68edf4bf | 2023-04-11 16:51:24 | 0.787879 | SVC | NaN | None | NaN | NaN | NaN | NaN | NaN | ... | NaN | NaN | NaN | NaN | NaN | NaN | NaN | NaN | NaN | None |
| 4b2656e5 | 2023-04-11 16:51:24 | 0.772727 | RandomForestClassifier | 0.0 | None | gini | NaN | sqrt | NaN | 0.0 | ... | [[26, 5], [10, 25]] | False | [Class 0, Class 1] | 0.12.1dev | sklearn_evaluation.plot.ClassificationReport | [[0.7222222222222222, 0.8387096774193549, 0.77... | [precision, recall, f1-score, support] | [0, 1] | 0.12.1dev | This is some comment |
| be5f2c0c | 2023-04-11 16:51:24 | 0.757576 | RandomForestClassifier | 0.0 | None | gini | NaN | sqrt | NaN | 0.0 | ... | [[28, 3], [13, 22]] | False | [Class 0, Class 1] | 0.12.1dev | sklearn_evaluation.plot.ClassificationReport | [[0.6829268292682927, 0.9032258064516129, 0.77... | [precision, recall, f1-score, support] | [0, 1] | 0.12.1dev | None |
| c5d9d833 | 2023-04-11 16:51:23 | 0.772727 | RandomForestClassifier | 0.0 | None | gini | NaN | sqrt | NaN | 0.0 | ... | NaN | NaN | NaN | NaN | NaN | NaN | NaN | NaN | NaN | None |
5 rows × 48 columns
Querying#
You can also use the .query() method with as_frame=True (default value) to get a pandas.DataFrame
df = tracker.query(
    """
SELECT uuid,
       json_extract(parameters, '$.model') AS model,
       json_extract(parameters, '$.accuracy') AS accuracy
FROM experiments
ORDER BY accuracy DESC
LIMIT 3
"""
)
df
| model | accuracy | |
|---|---|---|
| uuid | ||
| 68edf4bf | SVC | 0.787879 |
| c5d9d833 | RandomForestClassifier | 0.772727 |
| 4b2656e5 | RandomForestClassifier | 0.772727 |