Developer API#
AbstractPlot#
- class sklearn_evaluation.plot.plot.AbstractPlot(*, label=None)#
An abstract class for all class-based plots
- dump(path)#
Serialize the plot as
.jsonto the given path.
- classmethod from_dump(path)#
Instantiates a plot object from a path to a JSON file. A default implementation is provided, but you might override it.
- abstract classmethod from_raw_data()#
Takes raw unaggregated (for an example of aggregated vs unaggregated data see the constructor docstring) data, compute statistics and initializes the object. This is the method that users typically use. (e.g., they pass
y_true, andy_predhere, we aggregate and call the constructor).Apart from input data, this method must have the same argument as the constructor.
All arguments beyond the input data must be keyword-only (add a * argument between the input and the rest of the arguments).
- abstract plot(ax=None)#
All plotting related code must be here with one optional argument
ax=None. Must assign,self.ax_, andself.figure_attributes and returnself.
MyBar#
- class sklearn_evaluation.plot._example.MyBar(count, *, color=None, name=None)#
Bar plot. This is an internal plot targeted for developers, not intended for end-users.
- Parameters
count (dict) – A dictionary whose keys are labels and values are counts
color (string, default=None) – Color for the bars, must be a valid matplotlib color
name (string, default=None) – A value to identify this plot
Notes
New in version 0.9.
Examples
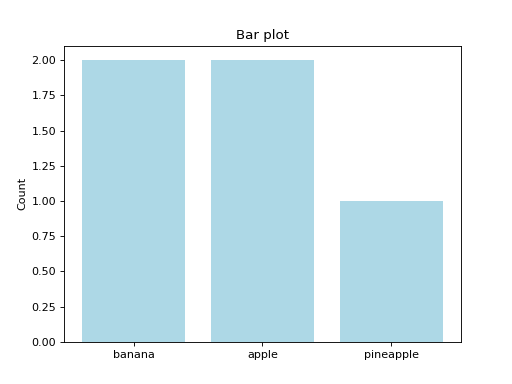
Create plot:
from sklearn_evaluation.plot._example import MyBar
MyBar.from_raw_data(["banana", "banana", "apple", "pineapple", "apple"],
                        color="lightblue")

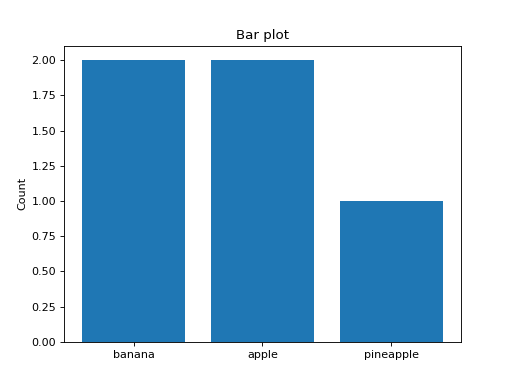
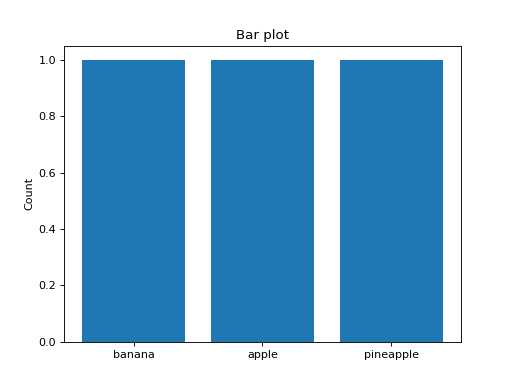
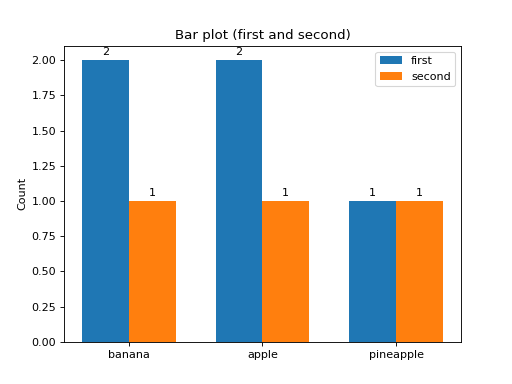
Compare plots:
from sklearn_evaluation.plot._example import MyBar
one = MyBar.from_raw_data(["banana", "banana", "apple", "pineapple", "apple"])
another = MyBar.from_raw_data(["banana", "apple",  "pineapple"])
one + another
- classmethod from_raw_data(things_to_count, *, color=None, name=None)#
check typical naming: such as y_pred, y_score, y_true
- Parameters
things_to_count (list) – The list of elements to count
color (string, default=None) – Color for the bars, must be a valid matplotlib color
name (string, default=None) – A value to identify this plot
- plot(ax=None)#
Create the plot
- Parameters
ax (matplotlib.Axes) – An Axes object to add the plot to
bar#
- sklearn_evaluation.plot._example.my_bar(things_to_count, ax=None, color=None)#
- Parameters
things_to_count (list) – The list of elements to count
color (string, default=None) – Color for the bars, must be a valid matplotlib color
Examples
from sklearn_evaluation.plot._example import my_bar
my_bar(["banana", "banana", "apple", "pineapple", "apple"],
       color="lightblue")