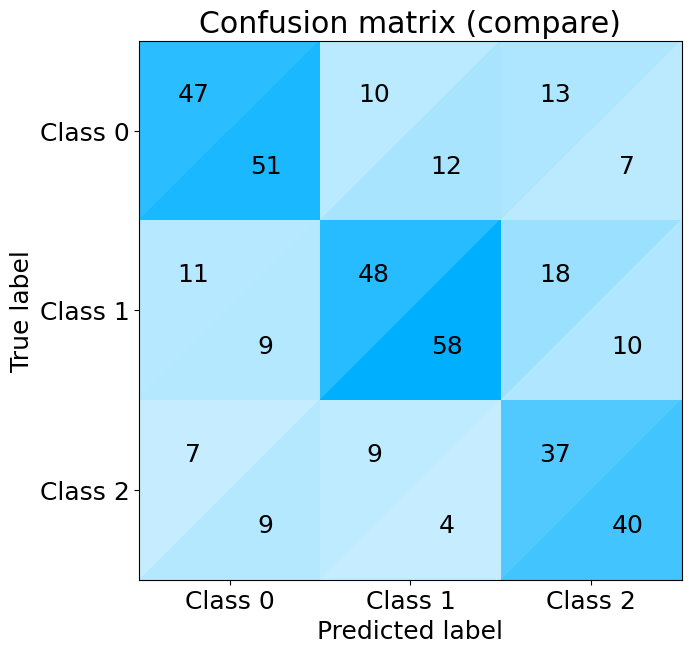
Comparison#
Learn how to easily compare plots from different models.
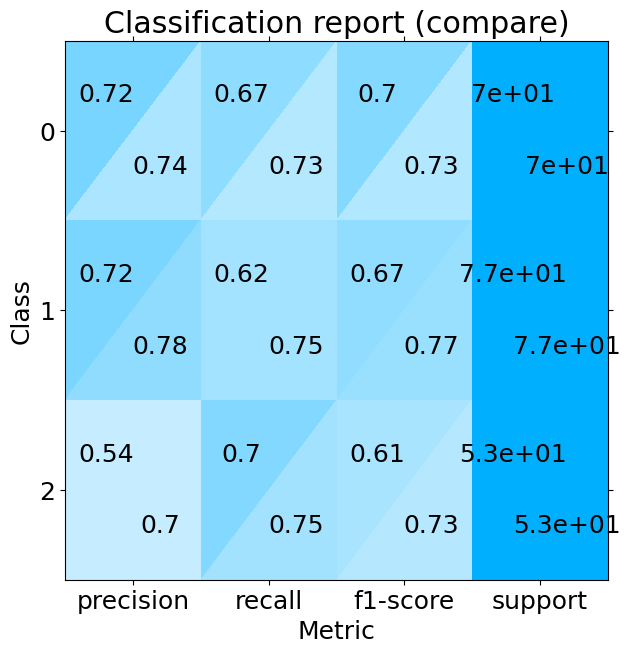
Compare two models by plotting all values:
plot1 + plot2Compare the performance between two models:
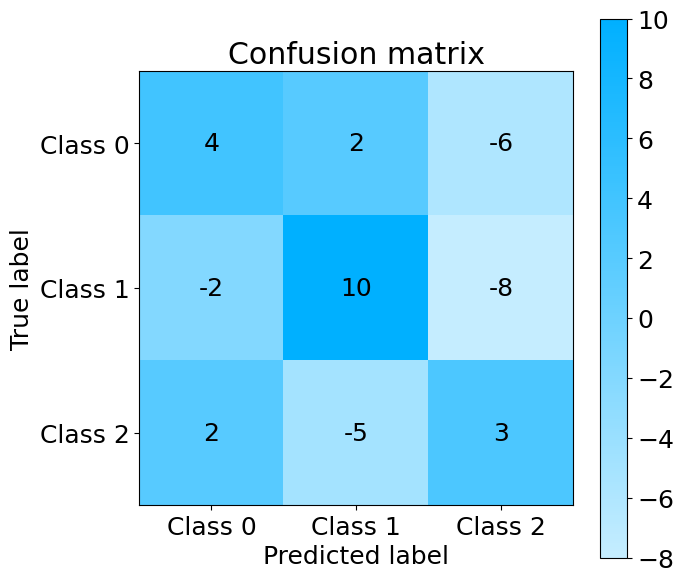
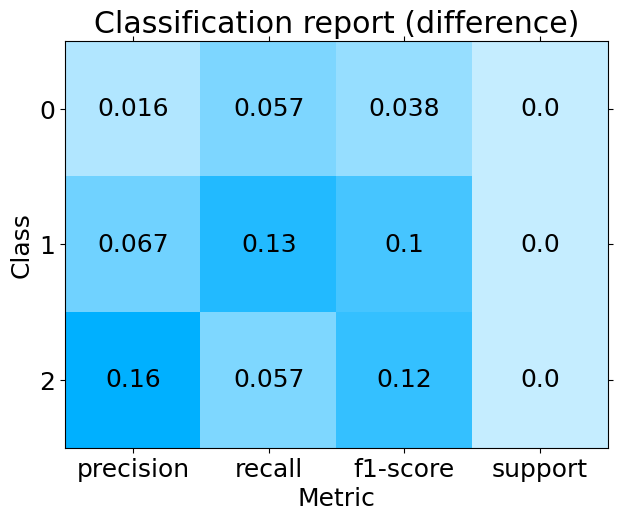
plot2 - plot1
Confusion matrix#
Added in sklearn-evaluation version 0.7.2
import matplotlib
from sklearn import datasets
from sklearn.linear_model import LogisticRegression
from sklearn.ensemble import RandomForestClassifier
from sklearn.model_selection import train_test_split
from sklearn.tree import DecisionTreeClassifier
from sklearn_evaluation import plot
matplotlib.rcParams["figure.figsize"] = (7, 7)
matplotlib.rcParams["font.size"] = 18
# get training and testing data
X, y = datasets.make_classification(
    1000, 20, n_informative=10, class_sep=0.80, n_classes=3, random_state=0
)

X_train, X_test, y_train, y_test = train_test_split(X, y, test_size=0.2)


# fit decision tree and random forest, return confusion matrices
tree_pred, forest_pred = [
    est.fit(X_train, y_train).predict(X_test)
    for est in [DecisionTreeClassifier(), RandomForestClassifier()]
]
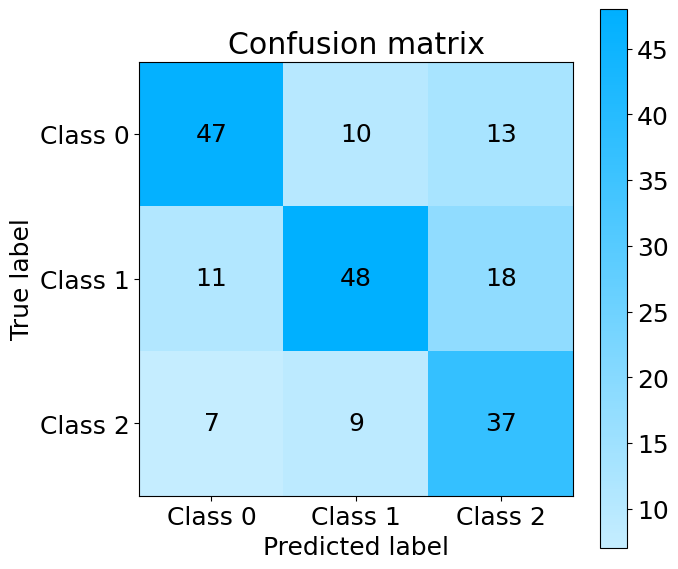
Decision tree confusion matrix#
tree_cm = plot.ConfusionMatrix.from_raw_data(y_test, tree_pred, normalize=False)
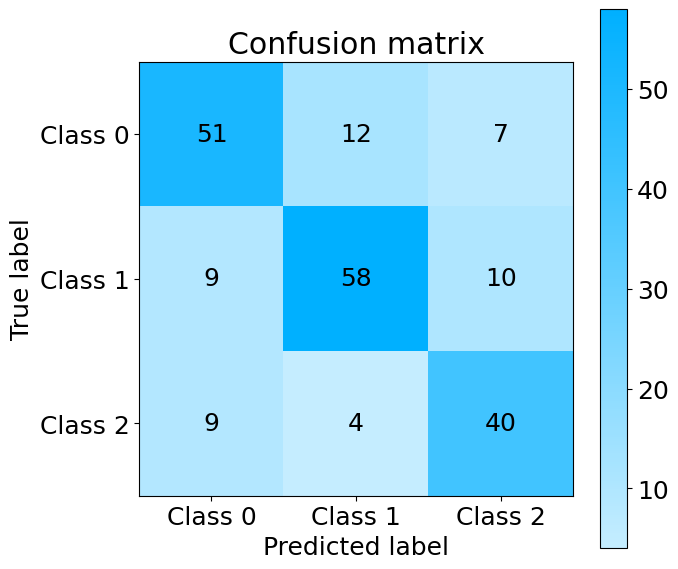
Random forest confusion matrix#
forest_cm = plot.ConfusionMatrix.from_raw_data(y_test, forest_pred, normalize=False)
ROC#
logistic_score, forest_score = [
    est.fit(X_train, y_train).predict_proba(X_test)
    for est in [LogisticRegression(), RandomForestClassifier()]
]
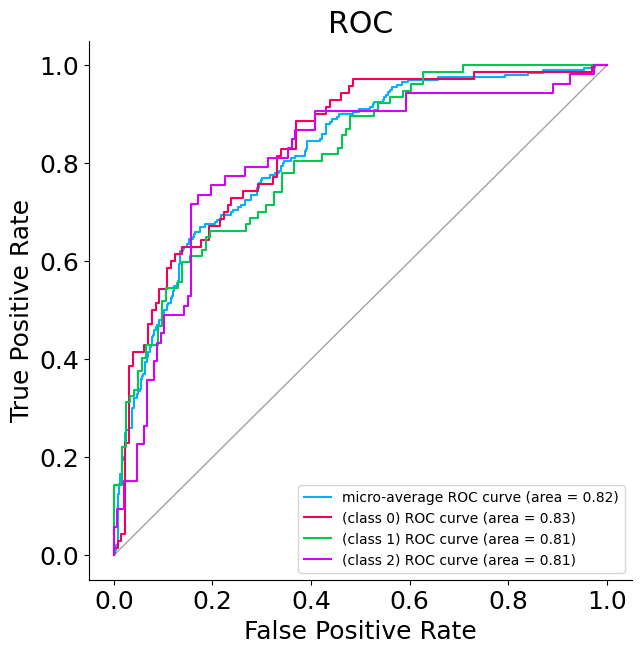
Logistic regression ROC#
logistic_roc = plot.ROC.from_raw_data(y_test, logistic_score)
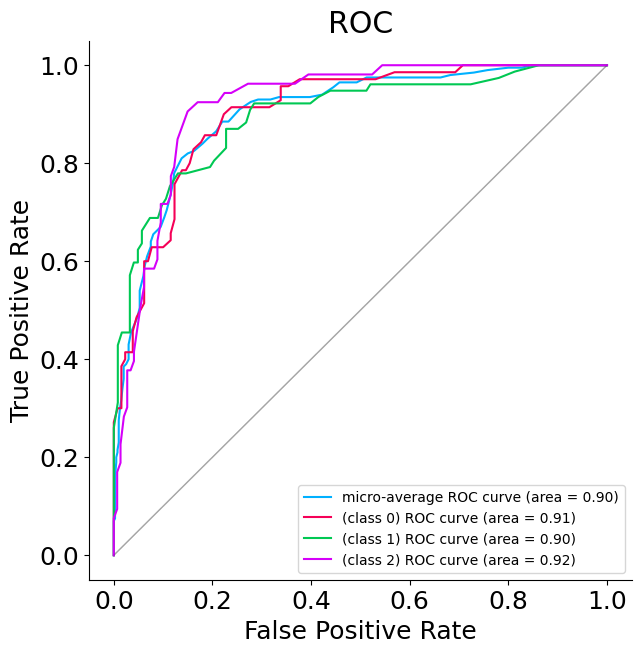
Random forest ROC#
forest_roc = plot.ROC.from_raw_data(y_test, forest_score)
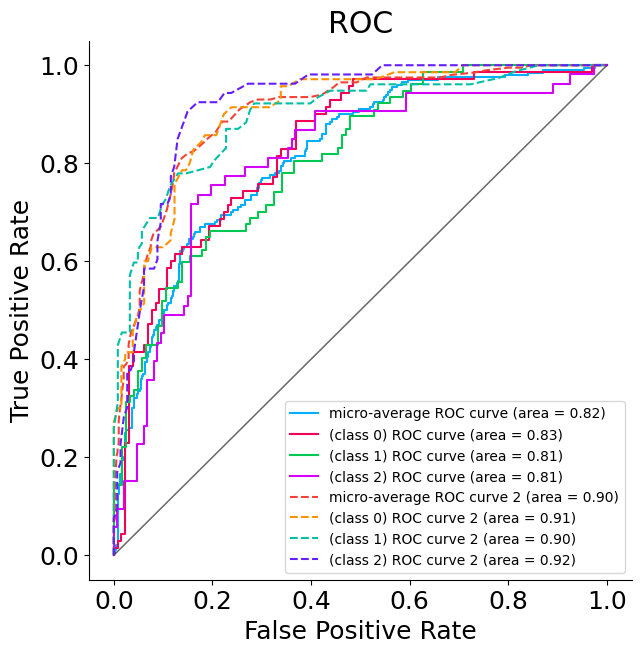
Compare ROC#
compare = logistic_roc + forest_roc
Classification report#
Added in sklearn-evaluation version 0.7.8
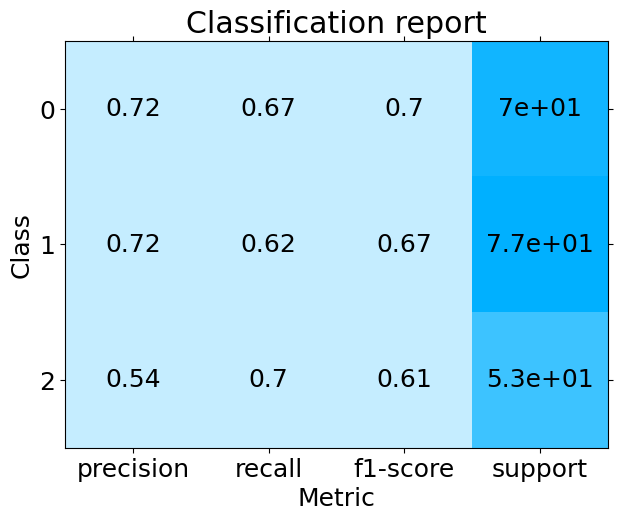
Decision tree classification report#
tree_cr = plot.ClassificationReport.from_raw_data(y_test, tree_pred)
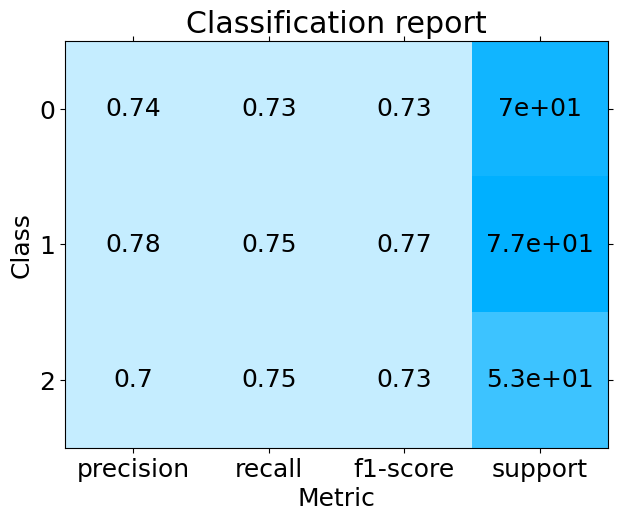
Random forest classification report#
forest_cr = plot.ClassificationReport.from_raw_data(y_test, forest_pred)
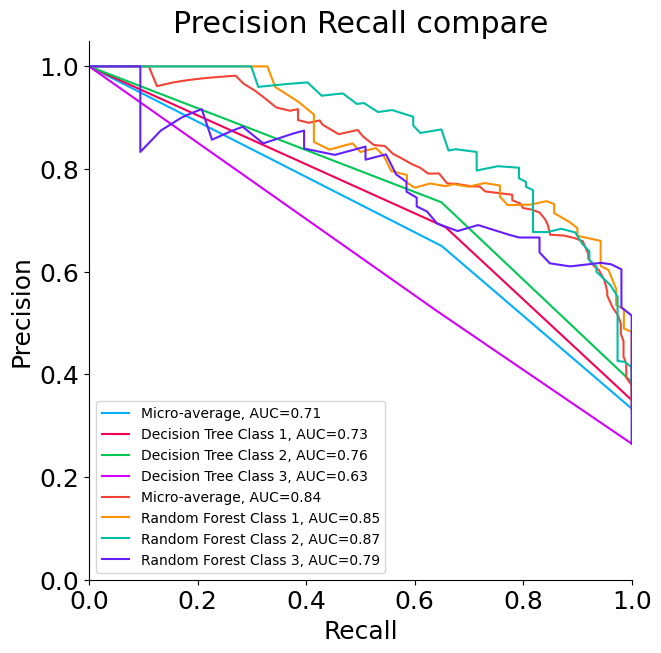
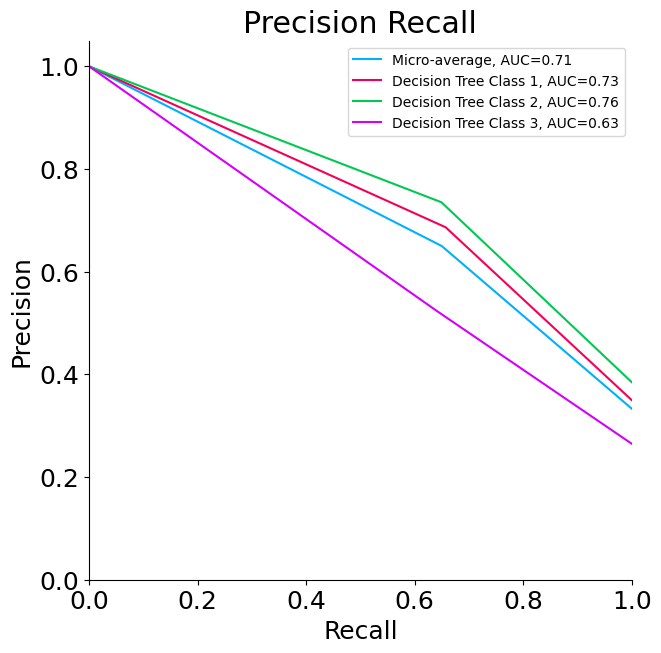
Precision Recall Curve#
tree_score, forest_score = [
    est.fit(X_train, y_train).predict_proba(X_test)
    for est in [DecisionTreeClassifier(), RandomForestClassifier()]
]
Decision tree PR#
tree_pr = plot.PrecisionRecall.from_raw_data(
    y_test,
    tree_score,
    label=["Decision Tree Class 1", "Decision Tree Class 2", "Decision Tree Class 3"],
)
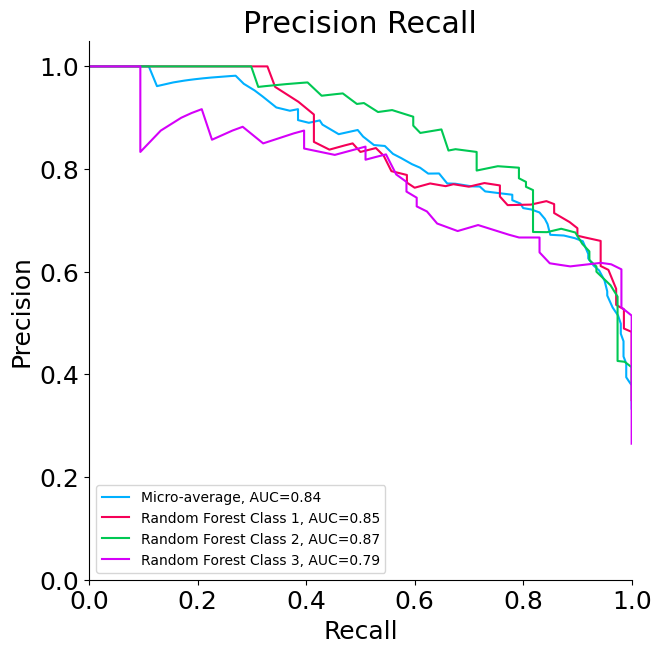
Random forest PR#
forest_pr = plot.PrecisionRecall.from_raw_data(
    y_test,
    forest_score,
    label=["Random Forest Class 1", "Random Forest Class 2", "Random Forest Class 3"],
)
Compare PR#
compare = tree_pr + forest_pr